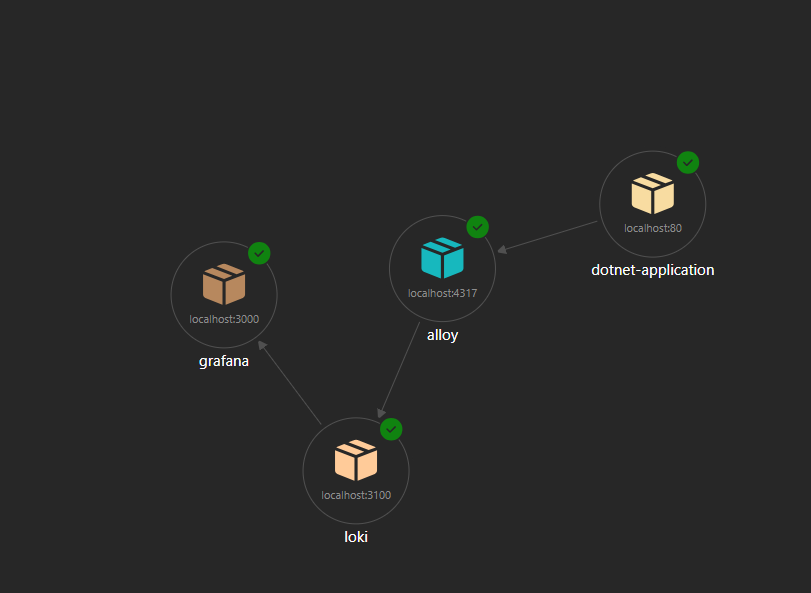
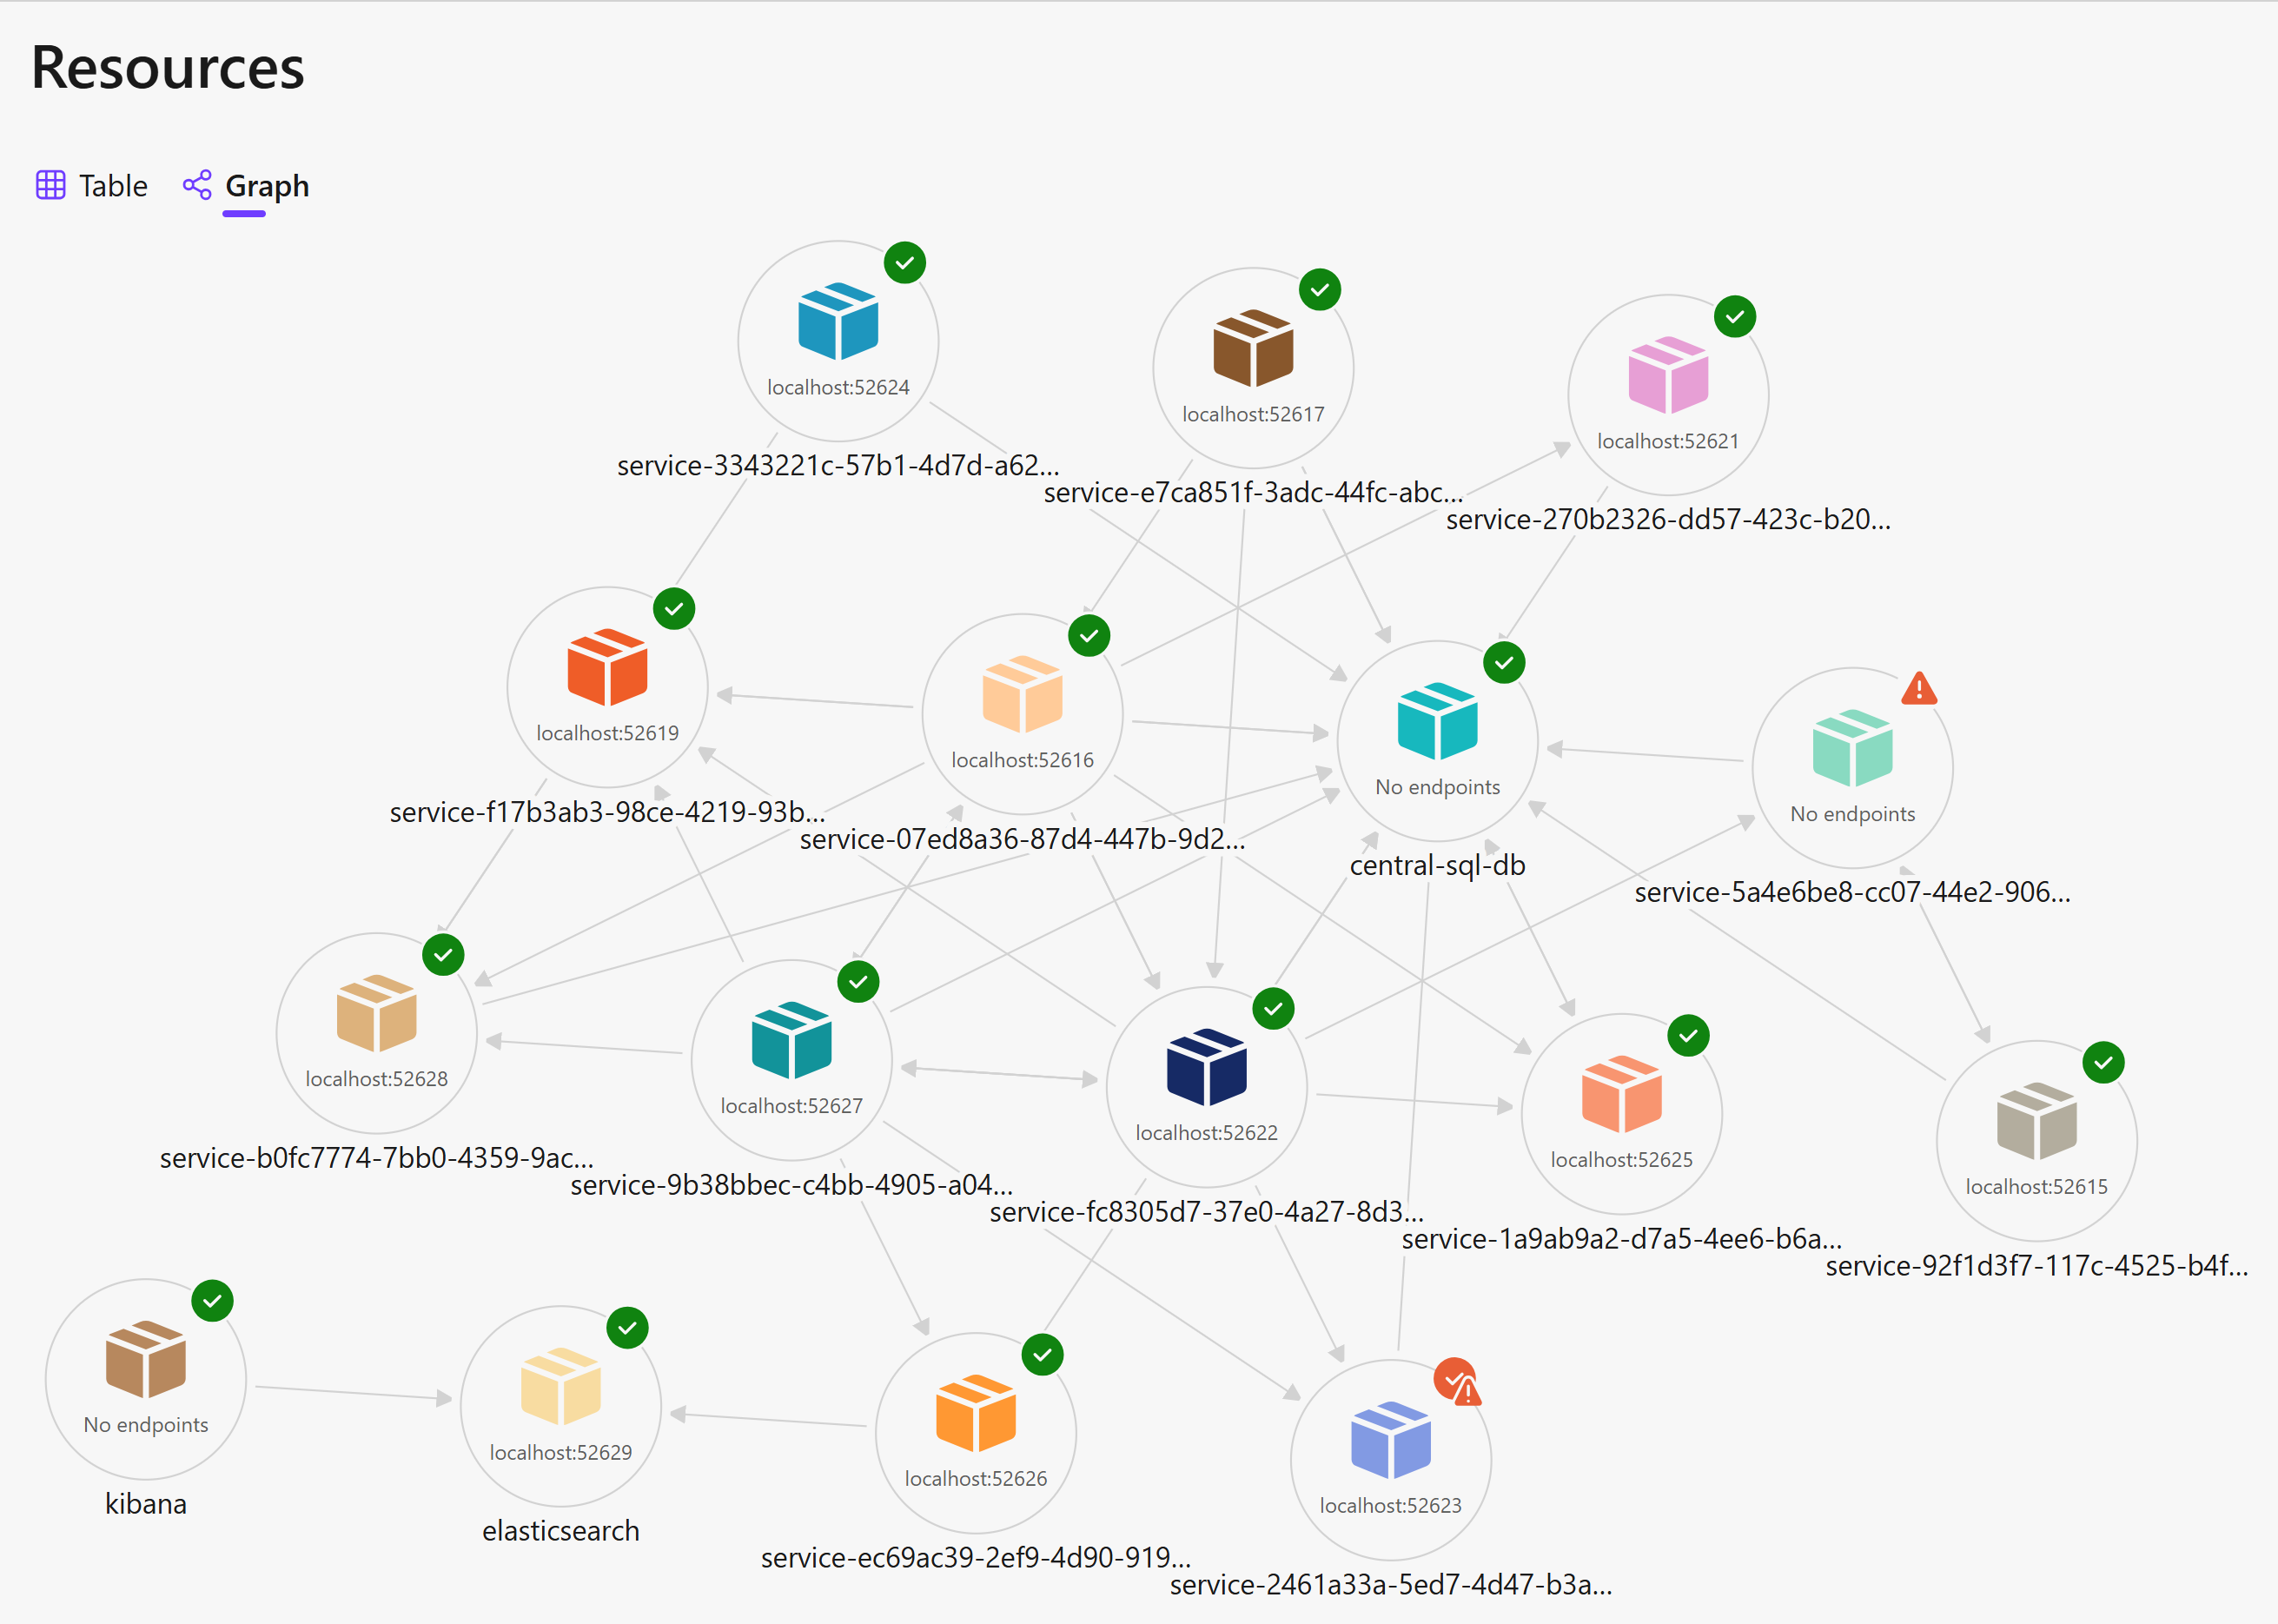
.NET Aspire 9.2 is here, bringing exciting new features to simplify infrastructure visualization. Whether you’re managing microservices or exploring Docker-based architectures, this release makes it easier than ever to create detailed infrastructure diagrams with minimal effort. Let’s dive into the highlights and see...

Logs are a critical part of monitoring and debugging modern applications. By integrating OpenTelemetry logs with Grafana using Loki and Alloy, you can centralize your log data, making it easier to analyze and monitor your .NET applications. In this blog, I’ll walk you through the setup process and share how these tools...

Grafana is an open-source analytics and monitoring platform that allows you to query, visualize, and alert on your metrics data. It is a popular tool for monitoring systems, applications, and services in real-time. In this post, I will guide you through setting up Grafana in Docker to monitor a simple .NET API. Setting...