Grafana is an open-source analytics and monitoring platform that allows you to query, visualize, and alert on your metrics data. It is a popular tool for monitoring systems, applications, and services in real-time. In this post, I will guide you through setting up Grafana in Docker to monitor a simple .NET API.
Setting up Grafana
To visualize metrics data, we need to set up a few components. Our .NET application will need a /metrics endpoint to describe the state of the system. Prometheus will scrape this endpoint every few seconds and store the data. Grafana will then query Prometheus to display the data in a nice dashboard.
Docker Compose File
Lets start with a docker compose file to bring up the services we need.
services:
  prometheus:
    image: prom/prometheus:v3.1.0
    ports:
      - 5431:9090
    volumes:
      - ./prometheus/:/etc/prometheus/
      - prometheus:/prometheus

  grafana:
    image: grafana/grafana:11.4.0
    expose:
      - "3000"
    ports:
      - 3000:3000
    volumes:
      - grafana:/var/lib/grafana

volumes:
  prometheus:
  grafana:
This spins up the grafana and prometheus containers, it maps some ports and maps some folders as volumes. Lets look at the config files for prometheus and grafana.
Prometheus Configuration
Next, create a prometheus.yml file to configure Prometheus:
global:
  scrape_interval:     15s
  evaluation_interval: 15s

scrape_configs:
  - job_name: 'api'
    scheme: 'https'
    tls_config:
      insecure_skip_verify: true
    scrape_interval: 10s
    scrape_timeout: 5s
    static_configs:
    - targets: ['api.example.com:443']
This configures how often the /metrics endpoint should be scraped, by default an endpoint at http://api.example.com/metrics will be scraped. As my api endpoint is running under https I have to set the tls_config to skip verification and set the scheme to https. scrape_interval is how often the endpoint is scraped and scrape_timeout is how long to wait for a response, it this is not specified the global config with be used.
More information about configuring prometheus can be found here
Grafana Config
You can now log into grafana on http://localhost:3000 with the default username and password of admin/admin. You will be prompted to change the password. You can now add a data source to connect to prometheus. Prometheus will be running on http://localhost:5431 , however if you are using docker desktop to you your docker compose it isn’t as simple as using that address. Because you want a docker container to access another docker container you need to use a special address. So in this case the address would be http://host.docker.internal:5431 .
host.docker.internal is a special DNS name that resolves to the internal IP address used by the host machine. This is particularly useful when you are running Docker containers and need to access services running on the host machine from within a container.
For example, if you have a web server running on your host machine and you want to access it from a Docker container, you can use host.docker.internal to refer to the host machine’s IP address.
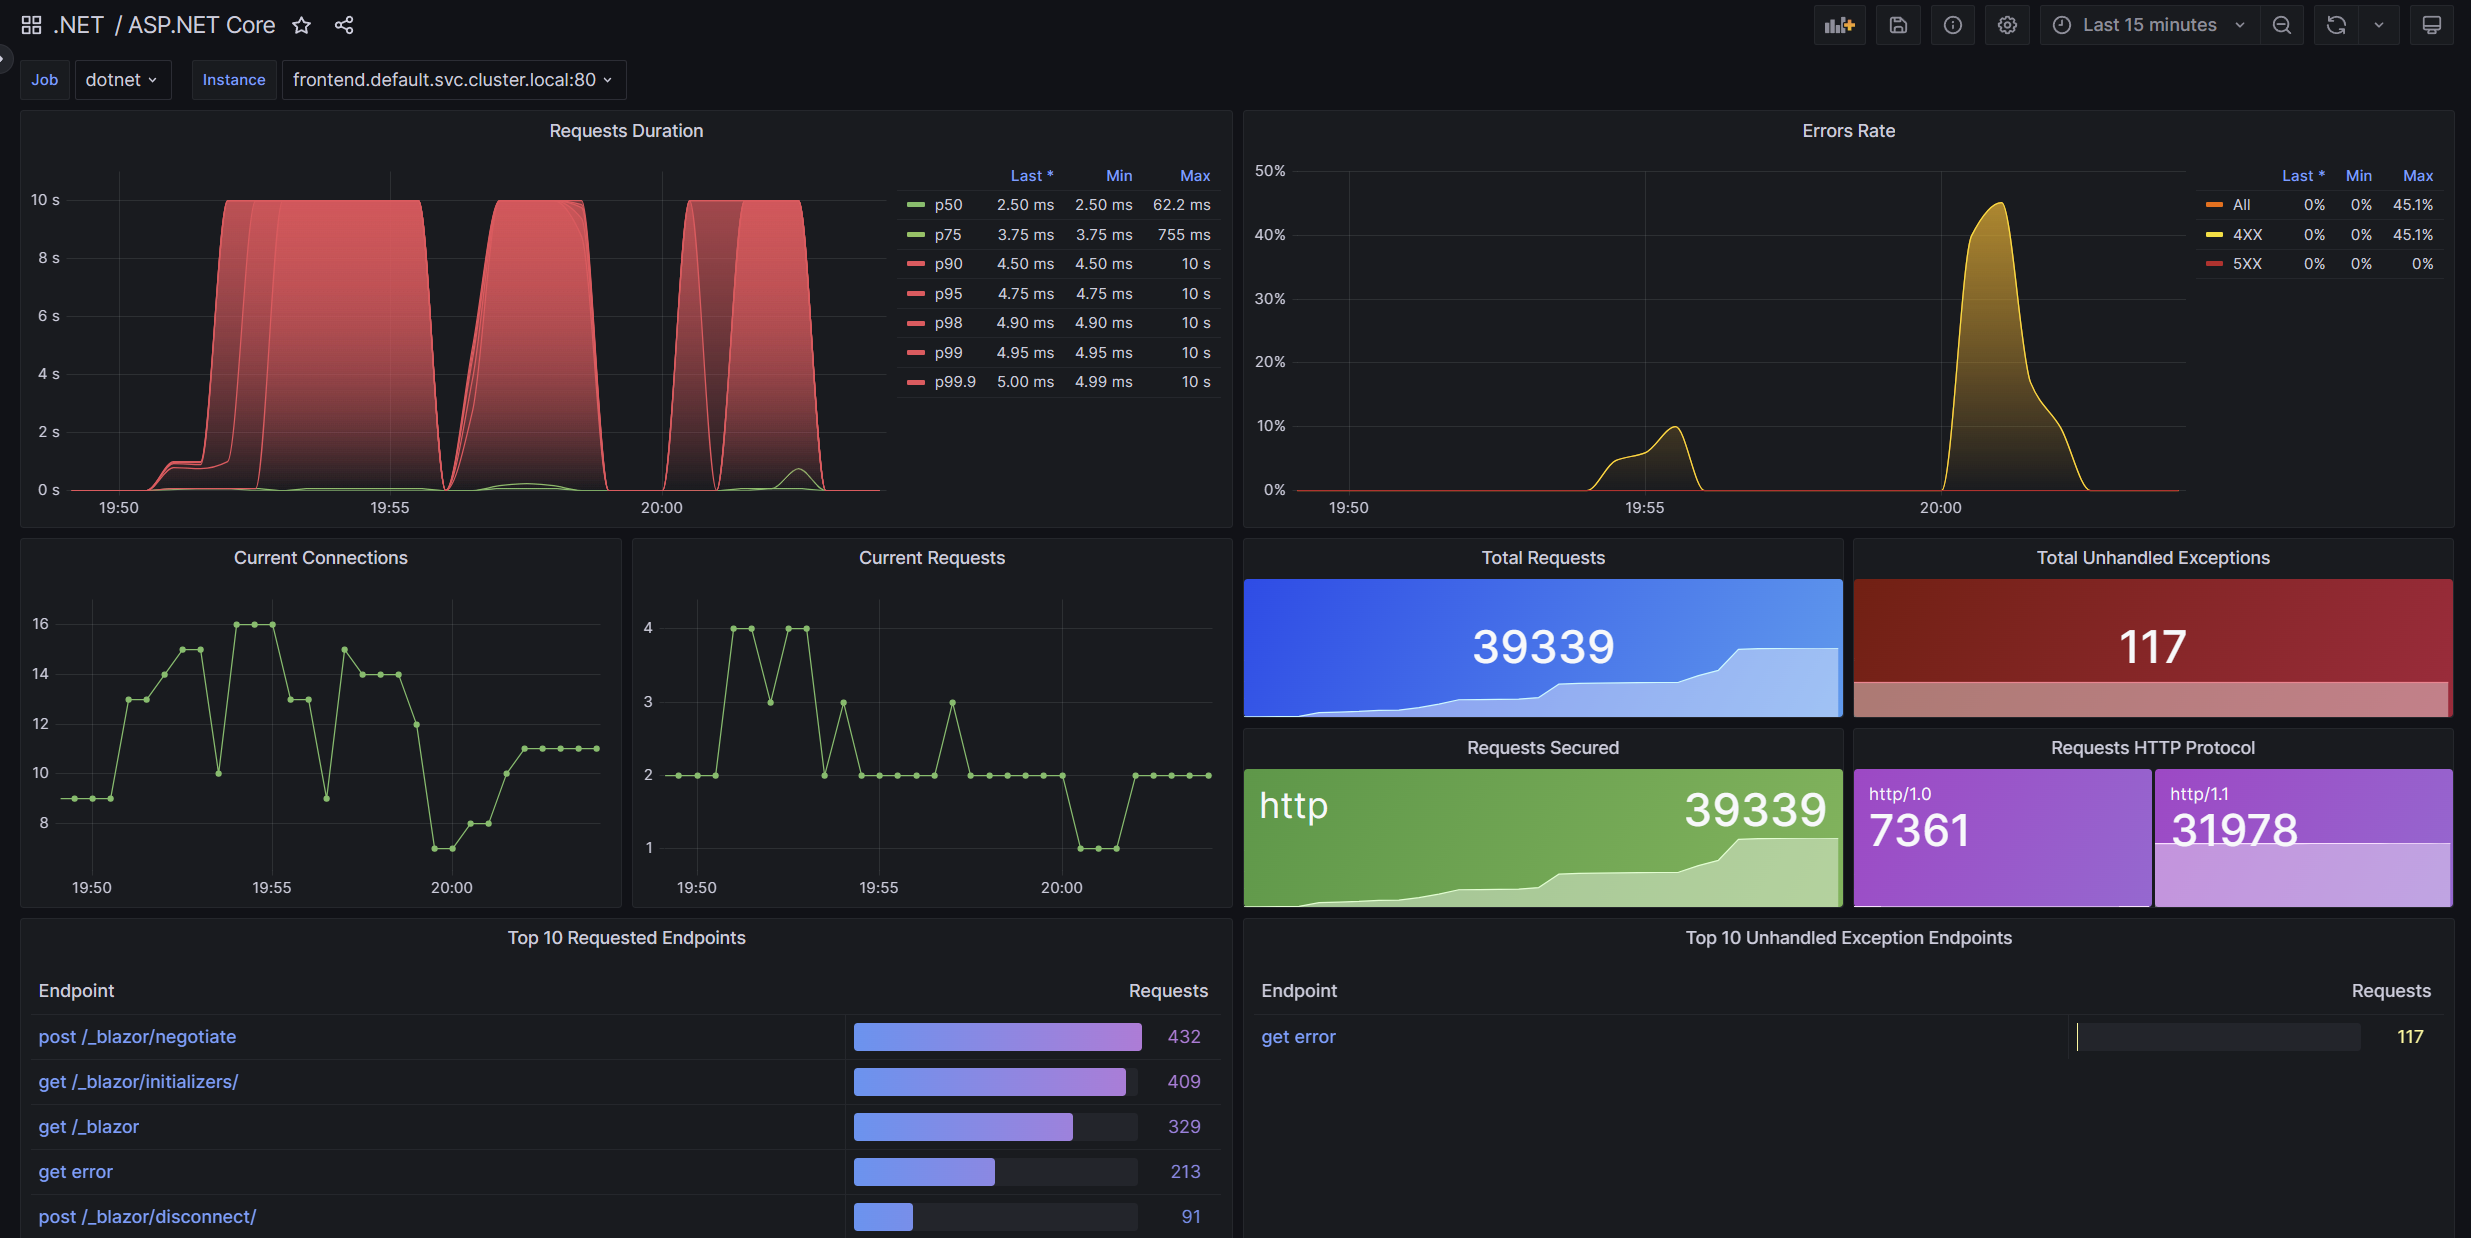
Dashboard
The next thing we need to do is build a dashboard, well the dotnet team has done the hard work for us. They have created a grafana dashboard that we can import into our grafana instance.
You can do all of this yourself by using the Grafana UI, to add the graphs, guages and other visualizations that you are interested in.
Metrics endpoint
If your .NET application is using .NET Aspire, this /metrics endpoint is probably already setup for you. Have a look at Extensions.cs in your ServiceDefaults project and check for the following code (you will need the nuget package OpenTelemetry.Exporter.Prometheus.AspNetCore):
public static WebApplication MapDefaultEndpoints(this WebApplication app)
{
  // The following line enables the Prometheus endpoint (requires the OpenTelemetry.Exporter.Prometheus.AspNetCore package)
  app.MapPrometheusScrapingEndpoint();
}
If you are not using .NET Aspire, you can add app.MapPrometheusScrapingEndpoint() to your Program.cs file.
Conclusion
By following these steps, you can set up Grafana with Docker and Prometheus to monitor your .NET applications. This setup allows you to visualize metrics and create real-time dashboards, providing valuable insights into your application’s performance. Happy monitoring!
If you have enjoyed this article and want to get a monthly email with all my latest articles, please sign up to my newsletter . If you have any questions or comments, please feel free to reach out or leave a comment below.
Comments