Logs are a critical part of monitoring and debugging modern applications. By integrating OpenTelemetry logs with Grafana using Loki and Alloy, you can centralize your log data, making it easier to analyze and monitor your .NET applications. In this blog, I’ll walk you through the setup process and share how these tools work together to streamline log aggregation and visualization.
I have blogged about Grafana before but until now I haven’t added logs to Grafana let’s have a look at how that works.
My dotnet application makes use of OpenTelemetry. I have been sending this telemetry to an Aspire Dashboard running in Docker. This allows me to view logs, metrics and traces.
Grafana has several tools that can help with logs.
- Loki: A log aggregation system designed to store and query logs from applications and infrastructure.
- Alloy: An OpenTelemetry collector that processes and forwards telemetry data.
- OpenTelemetry: A set of APIs, libraries, and tools for collecting and exporting telemetry data like logs, metrics, and traces.
I am using Alloy to collect OpenTelemetry from my application and send it to Loki, The logs in Loki can then be read by Grafana.
Setting Up Loki and Alloy with Docker Compose
To start off let’s add Alloy and Loki to my docker compose file.
Docker Compose Configuration
The docker-compose.yml file defines the services for Loki and Alloy. Here’s what each section does:
- Loki: Runs the Loki container on port 3100 and uses a local configuration file.
- Alloy: Runs the Alloy container, exposing ports for receiving telemetry data and processing logs.
# Docker Compose configuration for Loki and Alloy
    command: -config.file=/etc/loki/local-config.yaml # Specifies the configuration file for Loki

  alloy:
    image: grafana/alloy:v1.8.1
    container_name: monitoring_alloy
    ports:
      - 12345:12345 # HTTP server for Alloy
      - 4317:4317   # gRPC endpoint for OpenTelemetry
      - 4319:4318   # HTTP endpoint for OpenTelemetry
    volumes:
      - ./config.alloy:/etc/alloy/config.alloy # Mount Alloy configuration
    command: run --server.http.listen-addr=0.0.0.0:12345 --storage.path=/var/lib/alloy/data /etc/alloy/config.alloy
    depends_on:
      - loki
Here is the config file for Alloy.
otelcol.receiver.otlp "default" {
  http {}
  grpc {}

  output {
    logs    = [otelcol.processor.batch.default.input]
  }
}

otelcol.processor.batch "default" {
    output {
        logs = [
          otelcol.exporter.otlphttp.loki.input,
        ]
    }
}

otelcol.exporter.otlphttp "loki" {
  client {
    endpoint = "http://loki:3100/otlp"
  }
}
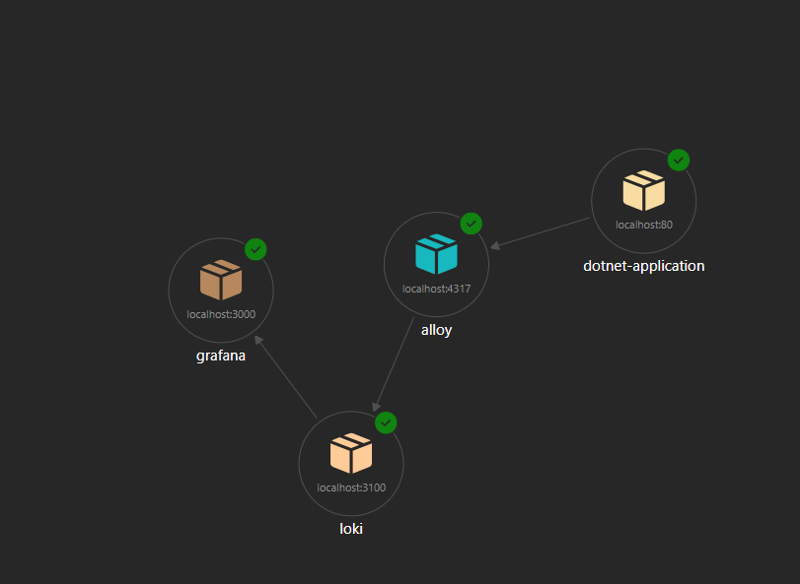
How the Components Work Together
- Application Logs: The .NET application generates logs and sends them to Alloy on port 4317.
- Alloy Processing: Alloy processes the logs and forwards them to Loki on port 3100.
- Loki Storage: Loki stores the logs, making them available for querying.
- Grafana Visualization: Grafana connects to Loki as a data source, allowing you to visualize and analyze the logs.
Handling Aspire Dashboard Logs
By default, sending logs to Alloy and Loki means Aspire Dashboard will no longer receive them. To resolve this, you can configure the AddOpenTelemetryExporters method in your .NET application to send logs to multiple destinations.
if (useOtlpExporter)
{
    // The following lines enable the OTLP exporter (requires the OpenTelemetry.Exporter.OpenTelemetryProtocol package)
    builder.Services.AddOpenTelemetry()
    .WithLogging(logging => logging.AddOtlpExporter(options =>
    {
        options.Endpoint = new Uri(builder.Configuration["OTEL_EXPORTER_OTLP_ENDPOINT"]);
    }))
    .WithLogging(logging => logging.AddOtlpExporter(options =>
    {
        options.Endpoint = new Uri(builder.Configuration["GrafanaExporter"]);
    }))
    .WithMetrics(metrics => metrics.AddOtlpExporter(options =>
    {
        options.Endpoint = new Uri(builder.Configuration["OTEL_EXPORTER_OTLP_ENDPOINT"]);
    }))
    .WithTracing(tracing => tracing.AddOtlpExporter(options =>
    {
        options.Endpoint = new Uri(builder.Configuration["OTEL_EXPORTER_OTLP_ENDPOINT"]);
    }));
}
If I update the AddOpenTelemetryExporters method in my Extensions.cs file in my .Net Aspire ServiceDefaults project, I can get my logs (or traces/metrics) to be sent to as many different places as I want. In my case I am sending to Allot and Aspire Dashboard.
Conclusion
Integrating OpenTelemetry logs with Grafana using Loki and Alloy provides a powerful solution for centralized log aggregation and monitoring. This setup simplifies debugging and enhances visibility into your application’s behaviour. If you haven’t tried it yet, give it a go and let me know your thoughts in the comments!
Comments