A long time ago in my SysAdmin days, I was a big fan of Nagios . Recently, I decided to revisit it and see if I could run it in a Docker container to monitor my local network. This guide will walk you through the process of setting up Nagios monitoring using Docker.
Finding a Docker Image for Nagios
First, we need to find a suitable Docker image for Nagios. The manios/nagios image looks like it should do the job.
Running the Nagios Docker Container
The basics of running this container are as follows:
docker run -d --name nagios -p 8080:80 manios/nagios
This command will pull the Nagios image from Docker Hub and run it in a container, mapping port 80 in the container to port 8080 on your host machine.
docker run -d --name nagios  \
  -v /path-to-nagios/etc/:/opt/nagios/etc/ \
  -v /path-to-nagios/var:/opt/nagios/var/ \
  -v /path-to-nagios/ssmtp.conf:/etc/ssmtp/ssmtp.conf \
  -v /path-to-custom-plugins:/opt/Custom-Nagios-Plugins \
  -p 8080:80 \
  manios/nagios
I prefer running via docker compose, which looks like this:
  nagios:
    image: manios/nagios:latest
    container_name: monitoring_nagios
    ports:
      - 8081:80
    restart: always
    volumes:
      - ./nagios/localhost.cfg:/opt/nagios/etc/objects/localhost.cfg
      - ./nagios/windows.cfg:/opt/nagios/etc/objects/windows.cfg
      - nagios_data:/opt/nagios/var/
    environment:
      - NAGIOSADMIN_USER=nagiosadmin
      - NAGIOSADMIN_PASS=nagiosadmin
      - NAGIOS_TIMEZONE=UTC
      - NAGIOS_WEB_USER=nagiosadmin
      - NAGIOS_WEB_PASS=nagiosadmin
Accessing the Nagios Web Interface
Once the container is running, you can access the Nagios web interface by navigating to http://localhost:8080 in your web browser. You should see the Nagios login page.
Configuring Nagios
To configure Nagios, you’ll need to edit the configuration files located in the container. You can do this by accessing the container’s shell:
docker exec -it nagios /bin/bash
From here, you can navigate to the Nagios configuration directory and make the necessary changes:
cd /opt/nagios/etc
Adding Hosts and Services
To monitor your local network, you’ll need to add hosts and services to the Nagios configuration. This involves editing the configuration files and adding each host and service you want to monitor.
I have added a few extra hosts to the localhost.cfg file to monitor my router, and a few other devices on my network. I have also added a Volume to store the nagios data, so after a restart of the container the data is still there.
Lets have a look at how hosts and services are defined in the config files.
define host{
        use                     linux-server
        host_name               router
        alias                   router
        parents                 localhost; Hosts that this host is dependent on
        address                 192.168.2.1; IP Address or DNS name of the host
}
define service{
        use                             local-service,graphed-service
        host_name                       localhost, router
        service_description             PING
        check_command                   check_ping!100.0,20%!500.0,60%
}
When making changes to your config files it is useful to check the config is valid. To do this with the docker file you can run the following command:
docker exec -it mynagioscontainer bin/nagios -v etc/nagios.cfg
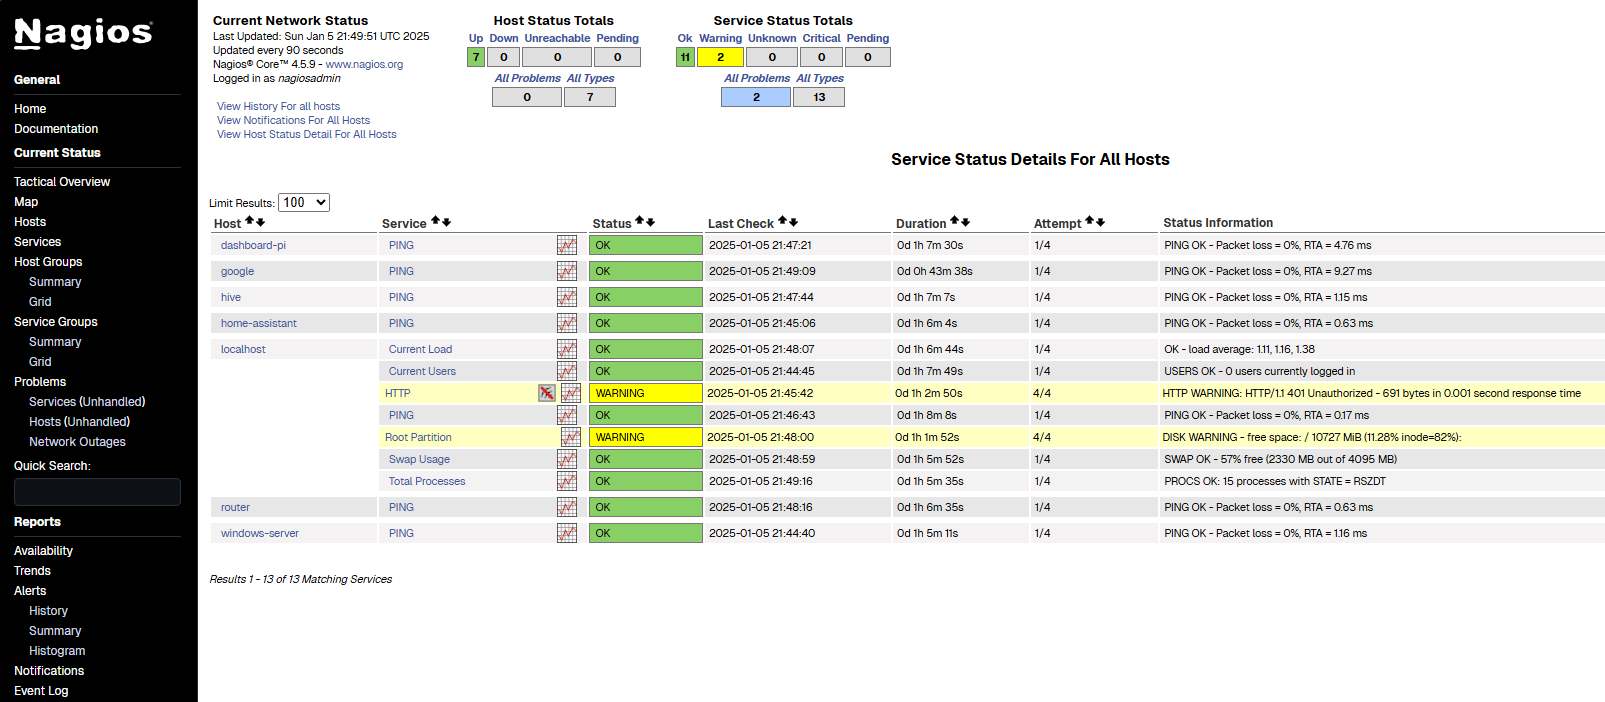
It may have been 10 years since I last looked at Nagios, but the UI hasn’t changed much. Host are checked if they are Up or Down, and every Host can have a number of services associated with it and this are checked if they are Up or Down.

Conclusion
By following these steps, you can set up Nagios monitoring using Docker to keep an eye on your local network. Nagios is a powerful tool for network monitoring, and running it in a Docker container makes it easy to deploy and manage. Happy monitoring!
Comments